Contour Lines & Slope Maps
Once the elevation data is acquired, the next step is to process the contour lines and the slope map of the field. To achieve this, we employ the CONREC algorithm, originally developed by Paul Bourke in 1986.
What is the Conrec Algorithm?
The CONREC algorithm is an efficient method for contour plotting. It generates contour lines over a grid of data points, where each line represents a constant elevation level. For this project, we utilized a Python implementation of the CONREC algorithm by Fernando Cucchietti.
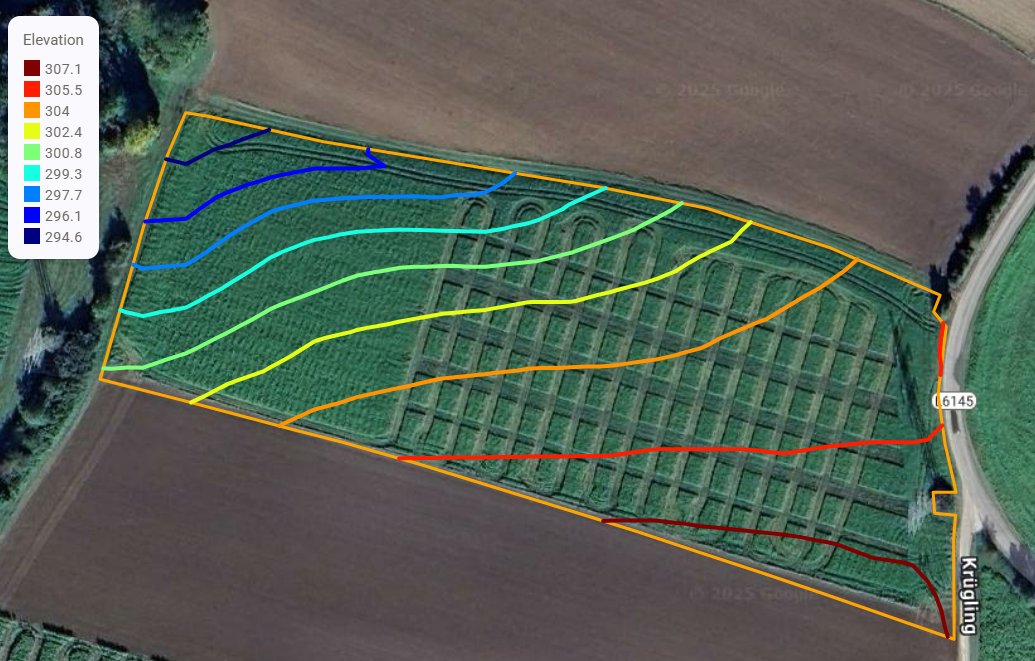
Contour Lines
Contour lines are lines drawn on a map that represent areas of equal elevation. These lines connect points that are at the same elevation, allowing you to visualize the shape and steepness of the land's surface.
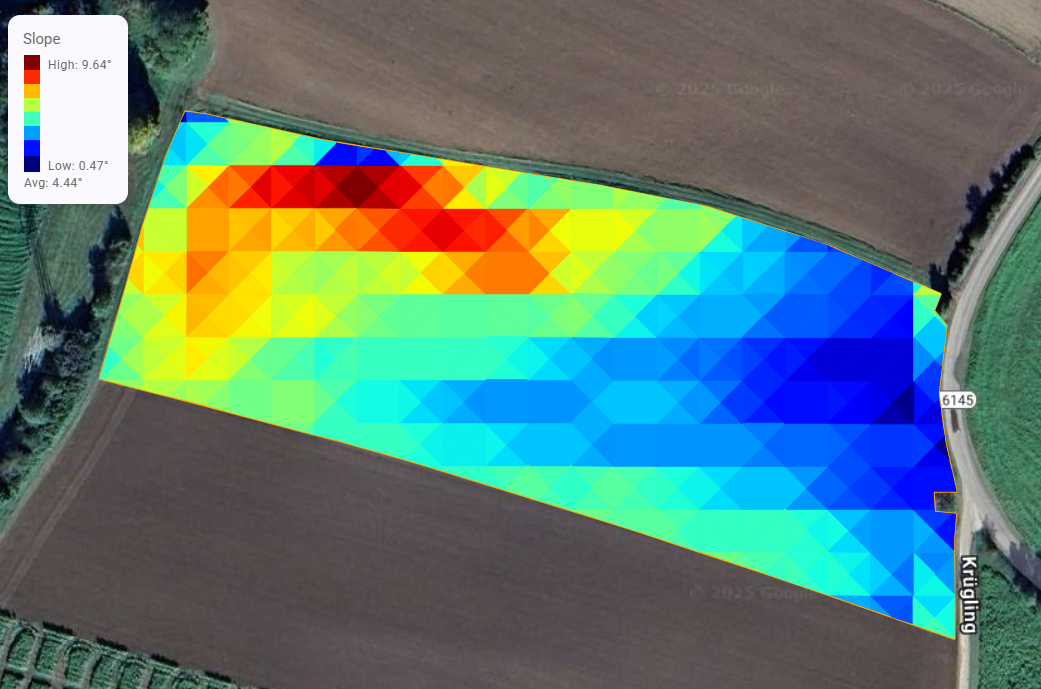
Slope Map
We modified the CONREC algorithm to generate beside contour lines a slope map of the field. Each triangle of the slope map is colored after the steepness of the terrain. These modifications allow for a more comprehensive representation of terrain features, ensuring that the AB-track calculations are not compromised by * insufficient contour line data*.
The key improvements include:
- Enhancing data distribution to avoid uneven spacing in contour lines, which can lead to missing terrain information in certain areas.
- Ensuring a uniform distribution of contour data to improve accuracy when calculating AB-tracks.
- Returning a level-line for every triangle instead of uneven spaced contour lines.